

After storing this idea in mothballs for quite a while, I finally decided to conduct an analytical study that would breakdown the most popular industries in the US based on the number of monthly online visitors. Special thanks to the SimilarWeb team, who helped me with the convoluted process of assembling data on the industry traffic distribution across 1,000 top-visited US domains.
The purpose of this research isn’t just to share some general trends and observations that will leave you thinking, “Sounds interesting, but what’s next?” I’ve also included a bunch of actionable ideas based off of the data I went over myself.
For those of you wondering whether it’s worth it to read this article in its entirety, below are the key findings:
- Google, Facebook, YouTube, Yahoo, and Amazon own 32.34% of the total US traffic market. These five online giants decide which sites we’re going to visit next and what ads we see.
- The top five industries in the US are Internet and Telecom, Arts and Entertainment, News and Media, Shopping, and Adult Entertainment. Altogether, these businesses control 82.55% of the US market share.
- In the Internet and Telecom Category, search engines and social network sites get up to 95% of the traffic share.
- Google, Yahoo, and Bing are the most visited search engine sites in the US However, that doesn’t necessarily mean that people use Yahoo as a search engine.
- Wikipedia.org has over 4.7 billion monthly users, with 86% of those users coming from organic search. Wikipedia is known to be a traffic-generating site.
- In the Shopping category, 74% of market traffic is split between Amazon (51.24%) and eBay (22.01%).
- Despite the fact that gambling is legally restricted in the US, it doesn’t stop YouTube from actively promoting this industry worldwide.
- In the Business sector, industries like Marketing, Advertising, and E-commerce have the smallest share compared to other subcategories.
- The tourism industry is extremely competitive; however, it has a diverse range of small- and medium-sized players, since the top domains occupy only 17% of the total market share.
82.55% of all US online traffic is shared among five industries
Over 80% of all US online surfers are divided among five industries, while the rest of the traffic (15%) is spread across more than 15 other niches. Among the top five leaders are Internet Telecom (45.9%), Arts and Entertainment (12.35%), News and Media (9.35%), Shopping, and the Adult industry.
I expected to see the Shopping industry at the top of the list with a much higher percentage of traffic, but it may not have made it to the top three because SimilarWeb defines YouTube as part of the Arts and Entertainment industry, which drives over 36% of traffic in this category.
The Reference category is represented mostly by Wikipedia with 1.32% of all US traffic. I can see how one day Wikipedia may be acquired by either Google or Facebook, jacking up their traffic and sales. Currently, Wikipedia is still a non-profit organization, and hopefully things will stay the way they are.

Over 30% (32.34%) of all US online traffic is controlled by five websites
In most cases, these five websites control what information we consume on a daily basis. Even more important, they also determine what sites we visit next and what kinds of ads we see. Here’s a list of the top five sites with their traffic market share:
- Google – 16.41%
- Facebook – 6.56%
- YouTube – 4.91%
- Yahoo – 2.55%
- Amazon – 1.91%
And yes, all the websites listed above offer advertising opportunities. If your site doesn’t have any visibility on Google and Facebook, you’re missing the majority of your audience because 67.4% of all US users search on Google, and Facebook gets 68% of all active web users. Without a doubt, Facebook may not be the right fit for all business types, but it is a must-have SMM channel for B2C products.
Keep reading to find out what I discovered about the top 10 categories as well as what kinds of subcategories they sprout into.
Please note that one of the categories has been left aside for the reason that is has no subcategories. Something tells me you’re well aware that Pornhub has the biggest market share in Adult Entertainment.
Internet and Telecom
According to the US Department of Commerce and the Bureau Of Economic Analysis, in 2015 the Information Industry was the largest contributor to the US economy’s 1.4 percent growth, adding close to $900 billion in value.
On the graph below you can see that over 41 percent of US traffic is shared between search engines and social network sites, which are getting most of the juice.
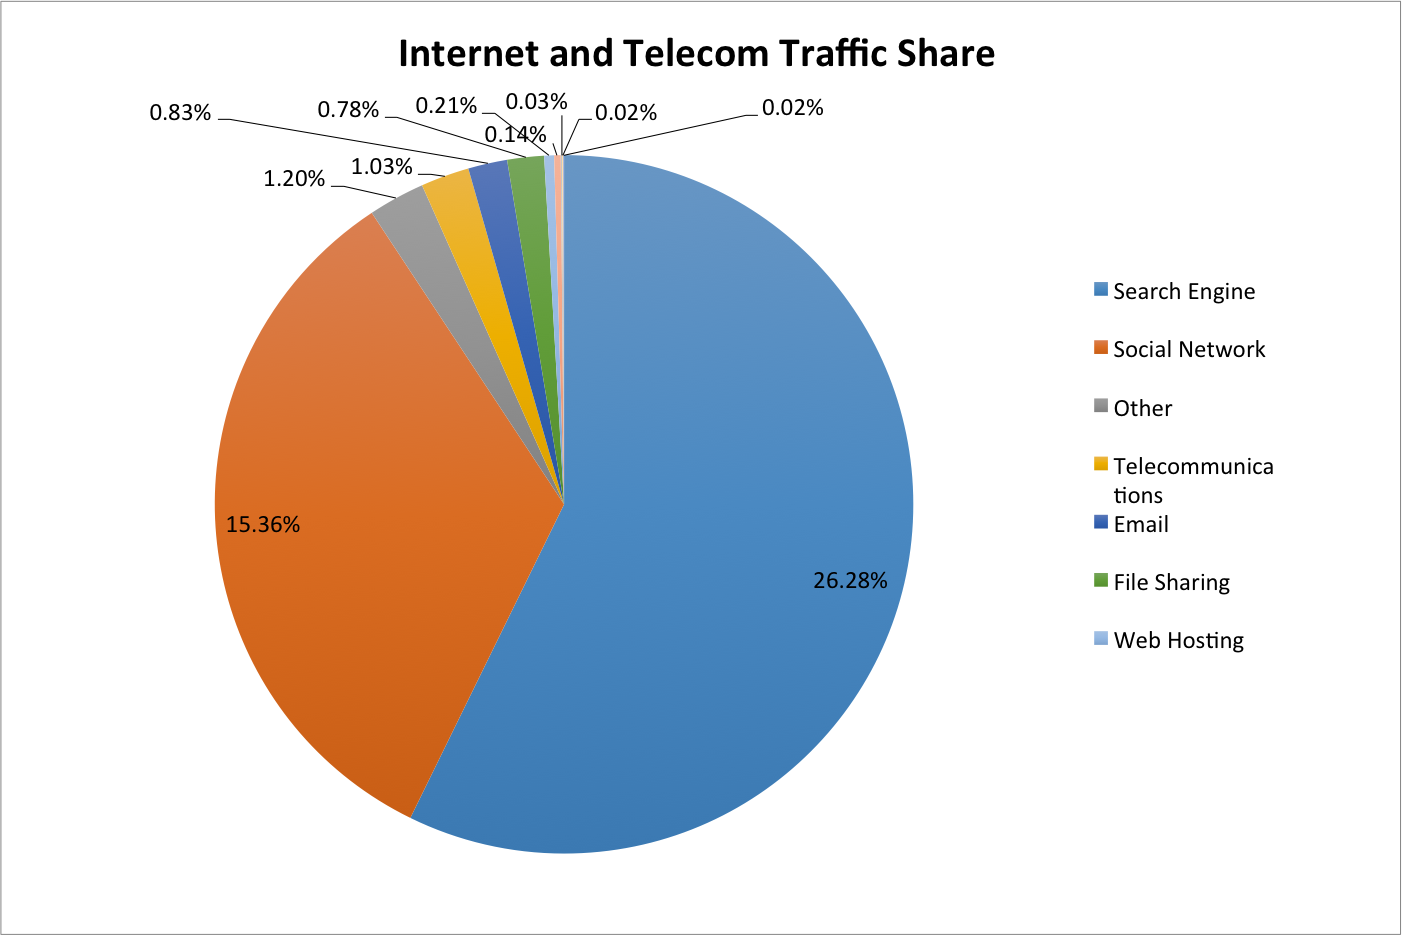
What I find really interesting is that SimilarWeb doesn’t recognize Yahoo as a search engine, and puts it in the News and Media category instead. That’s why, if you check the top search engines in the US, you won’t find Yahoo listed among them, but you’d be surprised to find Baidu.com ranking number five. That was quite a gem for me to discover even though the Chinese-speaking population in the US is remarkably high. This may be something digital marketers should pay close attention to, especially if they work for big international companies.
Another finding that really left me clueless is that the least popular Russian email agent, Mail.ru, appears to be among the top industry players — and Yahoo’s email agent still wasn’t there.
Google, Yahoo, and Bing are the most visited search engine sites in the US
Before I even started sifting through the data I gathered, I confidently assumed that I’d find Bing in second place. Turns out, the second-most visited search engine site is Yahoo.com.
So, does this mean that Yahoo is used more actively by online surfers than Bing? If you base your answer solely on the collected data, then the answer to the question is yes. But it’s not that simple.
Yes, it’s true that users visit Yahoo more frequently than they do Bing, but that’s not because they want to search for something on Yahoo. First of all, there’s a large group of people still using YahooMail (even though it’s 2017), and some people simply prefer checking for weather updates and news reports on Yahoo. With that being said, if we look at ComScore’s latest search engine popularity report, we will find that Yahoo is used as a search engine by 12.2% of all online US traffic and Microsoft is popular among 21.4%. But, realistically, Yahoo’s share of the search market is even smaller, since the majority of their search results are powered by Bing.
So if you’re considering Yahoo as a platform for promoting your product or service, check the demographics data around what kind of businesses typically advertise on Yahoo.
Speaking of demographic insights, I was struggling to find fresh ComScore reports (the last one was released more than three years ago), so I had to use Alexa.com. This isn’t the best and most accurate tool because the company gathers data from its own SEO toolbar, but it’s better than nothing.
Here’s what Alexa.com reports about Yahoo’s user demographics:
- There are more female users than male
- Most users are college-aged
- Following the previously mentioned trend, the top browser location is a school or a college
In order to determine which industries are advertising on Yahoo, I used Yahoo Ad Insights’ Industries report, which includes such businesses as:
- Automotive
- Consumer Packaged Goods (CPG)
- Entertainment
- Finance
- Retail
- Tech and TELCO
- Travel
And here I stumbled upon another controversial fact. Data from Alexa.com shows that the dominating age group consists of students who, in my opinion and judging from my own experience, can barely afford products that fall into industries like Finance or Retail. If you happen to have experience using Yahoo for advertising, I’d love to hear your thoughts.
Bing owns 0.48% of all traffic and 30% of the search engine market in the US
If we compare Bing with Yahoo, the former gets 3.35 times less traffic than Yahoo does. But as we have just discovered, Bing gets two times more search market queries compared to Yahoo. This means that it provides a lot more advertising opportunities for businesses. Also, the majority of Yahoo searches are powered by Bing, which means that once you’re ranking well in Bing, you automatically become visible in Yahoo.
All in all, Bing can boost traffic to your business by 30% and you don’t even need to invest in a new market or launch a new product or service. There’s no doubt you’ll need to put some effort into that process, but if you currently have a steady traffic flow from Google, then you’re already receiving visitors from Bing as well. You just need to analyze what exactly is going on with your Bing traffic, and find the right ways to take advantage of it. Here’s a great read supported with a video by John Lincoln who talks about SEO for Bing.
If you’re still not sure whether you should care about traffic coming to your site from Bing, here’s a great example. Searchengineland.com receives a little over 10% of Bing.com’s one million organic traffic visitors on a monthly basis:

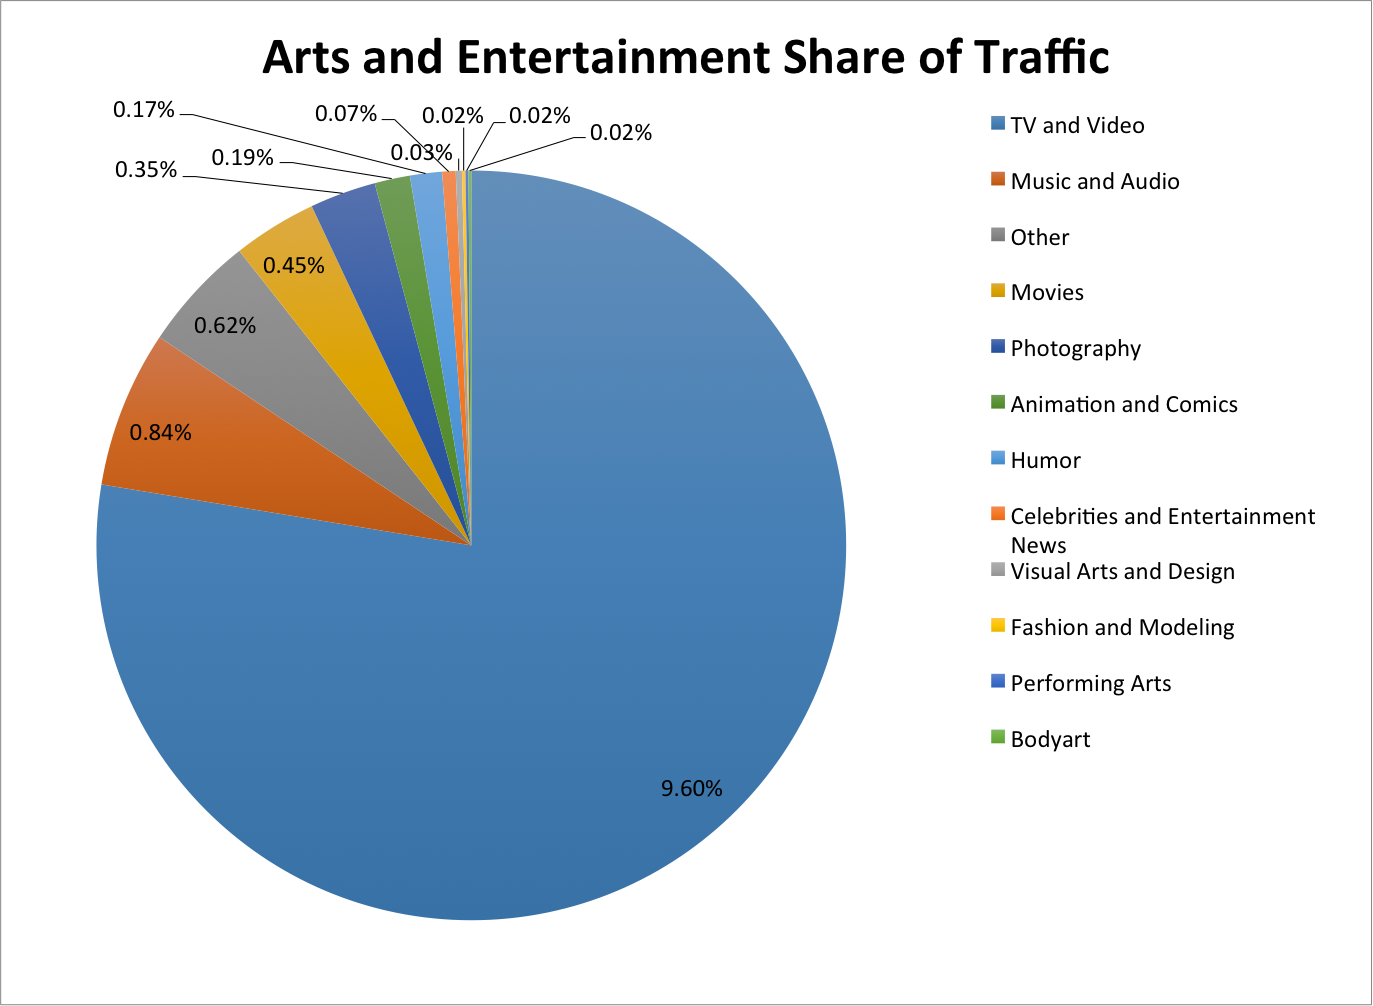
Arts and Entertainment
As I’ve previously mentioned, this category ranks second and owns over 12% of all US traffic, all thanks to YouTube. Also if we look at the top industry domains, we’ll find that Netflix gets 5.67% of all traffic in this category. I find it interesting that organic traffic isn’t the top referral traffic source for Netflix. Those would be direct (58.54%) and referrals (23.59%). Obviously, you can tell which of the media streaming platforms — YouTube or Netflix — Google gives its royal preference to. It kind of makes sense because all of Netflix’s content is on-demand.
The graph below demonstrates that YouTube gets three times more organic traffic than Netflix:

Digging deeper, we learn Google can’t list Netflix’s content in a video featured snippet because Netflix is only accessible with a paid subscription. In some way, Netflix is cornering itself.
The screenshot below shows that Netflix does have visibility in SERPs via the Knowledge Graph, but it’s not getting any traffic from this ranking because the Knowledge Graph doesn’t feature a link to a domain.

The Music and Audio subcategory has its own peculiar numbers. I was surprised to see Pandora as a leader, ahead with two times more traffic and leaving Spotify with only 3.68 percent.
The pie chart below gives you a breakdown of the traffic distribution for other subcategories:

Hinterlasse einen Kommentar